Uncover Your Internet Options: Explore Coverage with Our Dynamic Map
Discover the latest insights on internet availability with our comprehensive Internet Availability Map. This valuable tool helps you explore coverage options by location, showing you where internet access is readily available.
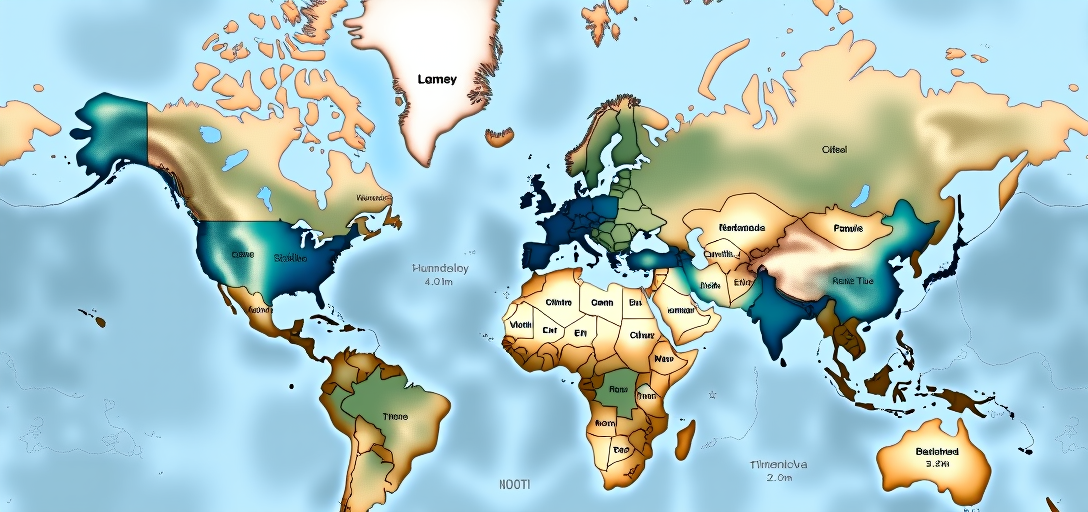
Understanding Internet Availability Maps
In today's digitally connected world, understanding where internet coverage is available is crucial, especially in the United States where connectivity can vary greatly between urban and rural areas. Internet Availability Maps are an essential tool that help consumers identify what kind of internet access is available at their specific location.
What are Internet Availability Maps?
Internet Availability Maps are specialized, interactive tools that visually represent the types and extents of internet coverage available in specific areas. These maps provide a detailed overview of various internet service providers (ISPs), connection types, speeds, and availability statuses. They are designed to assist households and businesses to make informed decisions about their internet options.
How Do Internet Availability Maps Work?
These maps leverage data from ISPs, government sources, and independent testing organizations to create a comprehensive visual overview. Factors typically showcased include:
- Coverage Area: Geographic areas where specific ISPs offer services.
- Connection Types: Fiber optic, DSL, cable, satellite, and fixed wireless technologies.
- Speed Tiers: Different maximum speeds offered, typically in Mbps.
- Provider Competition: Number of providers available in the area, offering competitive pricing and packages.
Benefits of Using Internet Availability Maps
Using these maps provides a host of benefits for consumers and businesses alike:
Informed Decision Making
Access to detailed coverage and performance data allows users to compare providers and choose the best option for their needs. For example, a household looking for high-speed gaming capabilities can compare connection speeds and latency across multiple providers.
Identifying Coverage Gaps
These maps play a pivotal role in identifying areas where internet access is limited or non-existent, providing critical information to policymakers and ISPs. According to the Federal Communications Commission (FCC), about 6% of Americans still lacked broadband access in 2025, with rural areas disproportionately affected. This data enforces the need for targeted infrastructure development.
Improving Service Reliability
By analyzing availability and performance data, consumers can choose ISPs known for high reliability and customer satisfaction. The 2026 Consumer Report on Broadband Services indicates that selecting a provider with local technical support and high uptime can significantly improve user experience.
Finding an Internet Availability Map
Many organizations offer maps that help consumers find internet coverage, including:
- FCC's Broadband Map: A comprehensive map featuring detailed broadband availability information across the US. Recent upgrades in 2026 have made this a more user-friendly tool. See more at FCC Broadband Map.
- Third-party Services: Websites like BroadbandNow and Ookla offer rich, user-friendly maps that show ISP competition, speed tests, and reviews. Visit BroadbandNow for more details.
How to Use These Maps
Using an Internet Availability Map is straightforward. Users typically enter their address or zip code into a search bar, which then displays the available options. Comparing ISPs becomes visually manageable, allowing users to assess factors like speed and pricing side by side.
Recent Developments in Internet Availability
Expansion of Fiber Networks
In 2026, the United States has seen significant expansions in fiber optic infrastructure, driven by both private and public investments. This high-speed, reliable option is increasingly available in urban and suburban areas, with rural deployments on the rise.
The Rise of Fixed Wireless Access
Fixed wireless has emerged as a viable high-speed internet option, especially in rural areas underserved by other broadband technologies. Continued advancements in technology are enhancing service quality and expanding reach, making it a key player in bridging the digital divide.
5G Deployment
The rollout of 5G networks marks a new era in mobile and fixed wireless internet services. Offering high speeds and low latency, 5G is expected to better serve both densely populated urban centers and remote locations that traditional broadband struggles to serve efficiently.
Conclusion
Internet Availability Maps are indispensable tools for understanding and improving internet access in the US. As technology advances and infrastructure investments grow, these maps will continue to play a vital role in ensuring every American has access to reliable and affordable internet service. With many resources available, consumers can make informed choices that suit their needs while advocating for better service in underserved areas.
By leveraging these tools effectively, both individuals and communities can partake in the digital economy, ensuring no one is left behind in this increasingly connected world.